Making CCHS analysis faster and easier to repeat
Table of Contents
Public health teams spend an appreciable amount of time responding to requests to analyze CCHS data. These requests often require complex code, and even small changes in scope can mean updating the analysis workflow. As a result, some opportunities to use CCHS data are missed. The work is time-intensive, and it often depends on a small number of experts who understand how to apply the required weighting and bootstrap techniques correctly.
At WDG Public Health, we are reimagining the CCHS analytics process by creating an automated way to analyze the data while maintaining the same technical accuracy. An automated approach would reduce the time required for routine requests and allow teams to reallocate that time to other priorities. The goal is to make the process easier to use, easier to share, and easier to improve through collaboration and an open approach to development.
The challenge #
CCHS is technically intensive to work with because several analytical requirements need to meet to be able to produce statistically accurate variance estimates.
A single estimate might require several steps: applying survey weights, estimating uncertainty with bootstrap weights, filtering geography correctly, and checking whether variable names or categories have changed across cycles. Even when an analyst knows how to do all of this, the analysis can still be slow, repetitive, and hard to hand off.
That creates a familiar problem: the workflow depends on one or two people, and it is difficult for others to pick up.
The tool #
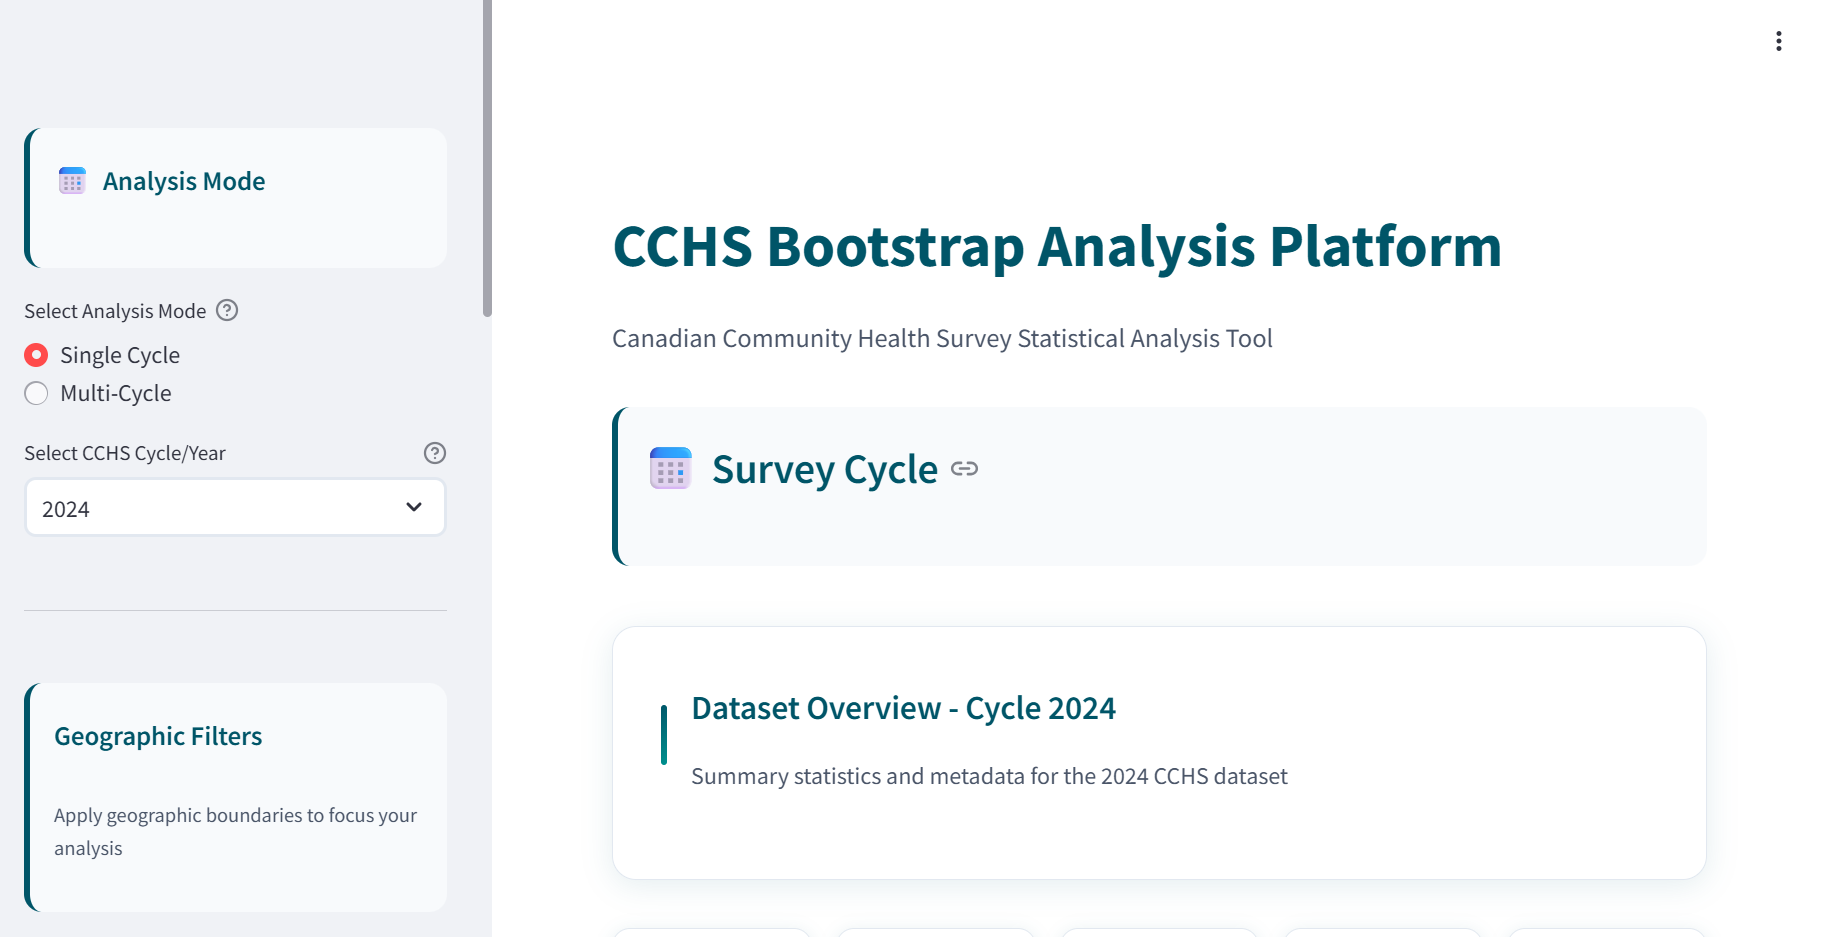
The application developed at WDGPH is a Streamlit-based platform for analyzing Ontario CCHS data with bootstrap methods. It supports both single-cycle analysis and multi-cycle analysis across the 2021, 2022, 2023, and 2024 survey years. The statistical methods used are unchanged, but the tool makes them easier to apply, step by step.
At a high level, the tool is used with the following steps:
- Select a survey cycle or choose multiple cycles for comparison.
- Apply geographic filters such as health region, municipality, or district.
- Merge the selected records with bootstrap weights.
- Search and select variables for analysis.
- Run weighted prevalence calculations with bootstrap confidence intervals.
- Review tables, charts, age-stratified outputs, and exports.
Multi-cycle support #
One of the biggest challenges in multi-cycle analysis is ensuring that variable names, labels, and category definitions remain consistent across years. The tool addresses this by supporting variable harmonization across cycles, making it easier to combine data and perform analyses over time.
Geographic filtering #
The tool provides geographic filtering down to individual PHU regions and municipalities, making it easier to analyze data at the local level.
The statistics #
The core analysis uses survey weights to estimate prevalence and bootstrap replicate weights to estimate variance, standard deviation, confidence intervals, and coefficient of variation. The outputs also apply quality flags based on Statistics Canada guidance, so users can distinguish between estimates that are stable and those that warrant caution.
In practice #
When an analyst gets a request to analyze, for example, smoking prevalence in their region, broken down by age, they can use the app to filter for the right geography, select the variable to analyze, and run the bootstrap estimates. They can also choose to run the analysis across more than cycle and for several geographical areas or jurisdictions, based on their needs. They can clearly follow each stage of the process. The output obtained includes data quality flags, based on Statistics Canada’s latest data quality and methods guidelines, to help analysts decide whether to release the results with or without a caution, or suppress them.
Next steps #
We are planning to open-source this project once it reaches a stage where it meets our internal standards. We also welcome collaborations from other PHUs to help take the project forward by sharing expertise and suggesting improvements based on the feedback we receive.
Closing #
This project was initiated as a solution to a problem we kept running into ourselves. our hope is that it can help others who face similar challenges working with CCHS data and make this type of analysis more accessible. If that sounds useful to you, feel free to express your interest through the CCHS pilot page and join the conversation